Bitcoin Price Prediction as BTC Shows Strong Bearish Momentum
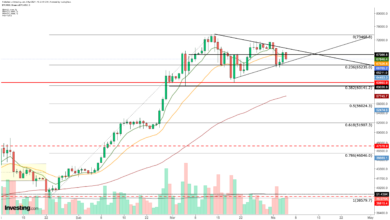
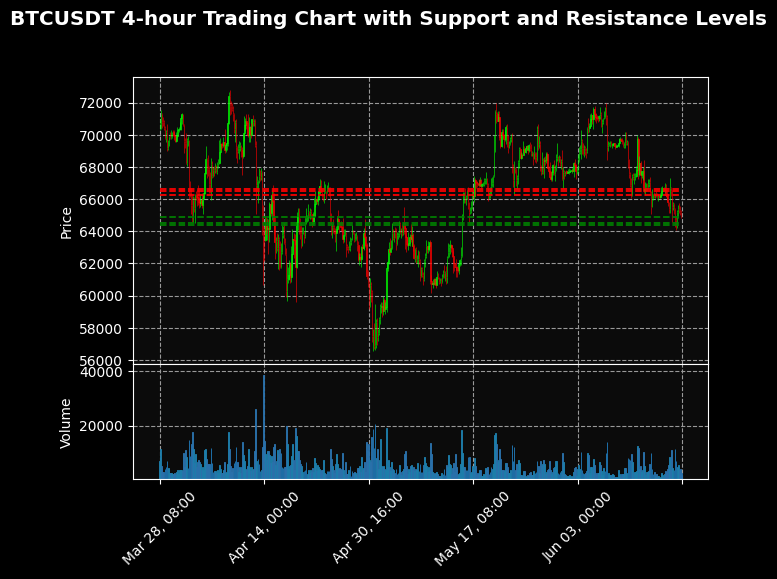
This Bitcoin price prediction comes as the 4-hour chart reveals notable bearish momentum. Recent closing prices show a gradual decline, with the latest price at $64,995.99, suggesting sustained downward pressure.
Bitcoin Price Technical Overview
The Exponential Moving Averages (EMAs) provide further insight into this bearish trend. The 9 EMA is currently trending below the 20 EMA, indicating short-term bearishness. Furthermore, the 9 EMA has been consistently below the 20 EMA. This highlights a lack of upward momentum and reinforces the bearish outlook.
Also read: Pepe Price Prediction: Is a Major Rebound on the Horizon?
Meanwhile, the Moving Average Convergence Divergence (MACD) adds another layer to this analysis. The MACD line is below the signal line, and the histogram is negative, indicating increasing bearish momentum. The widening gap between the MACD and the signal line suggests that the bearish trend might continue as well.
BTC’s 4-hour Relative Strength Index (RSI) is currently in the low 40s, reflecting bearish sentiment but not yet reaching oversold territory. This indicates that while there is selling pressure, the market has not reached an extreme condition where a reversal might be imminent.
Bitcoin Price Prediction: Key Levels to Watch
Support levels at $64,890.0, $64,538.0, and $64,412.19 are critical to monitor. If the Bitcoin price breaks below these levels, it could signal a further decline, presenting potential entry points for short trades. Conversely, these support levels could act as a bounce-back point, providing opportunities for long trades if a reversal is observed.
On the resistance side, the levels at $66,263.84, $66,503.8, and $66,630.9 are significant. A break above these levels would indicate a potential shift in momentum, providing exit points for short trades and entry points for long positions.
For traders considering short positions, the current bearish indicators suggest that entering trades near resistance levels with targets around the support levels might be beneficial. Setting stop-loss orders just above the resistance levels can help manage risk.
Also read: Best Crypto Exchanges: Your Guide to Secure and Efficient Trading in 2024
For those looking at long positions, it would be prudent to wait for signs of a reversal, such as a crossover of the EMAs or a bullish divergence in the MACD. Entry points around the support levels with targets near the resistance levels can be considered, with stop-loss orders placed just below the support levels to mitigate potential losses.
The BTC 4-hour chart currently indicates bearish momentum, with key support and resistance levels playing a crucial role in potential price movements. Traders should exercise caution and use technical indicators to inform their trading strategies, keeping an eye on critical levels for entry and exit points.
Disclaimer: The information presented in this article is for informational and educational purposes only. The article does not constitute financial advice or advice of any kind. Ecoinimist is not responsible for any losses incurred as a result of the utilization of content, products, or services mentioned. Readers are advised to exercise caution before taking any action related to the company.