NFP Preview: Key Data Points, Market Indicators to Watch Ahead of a Pivotal Report
Stocks finished the day flat ahead of the job report, which seems to be coming ahead of a lot of back-and-forth as to whether the job market is crumbling or not. I have a feeling that is not going to be the case. After all, it is an election year, right? That reasoning is used a lot these days to explain why the stock market won’t go down, and so it seems to make sense that an incumbent president would not want a rising unemployment rate.
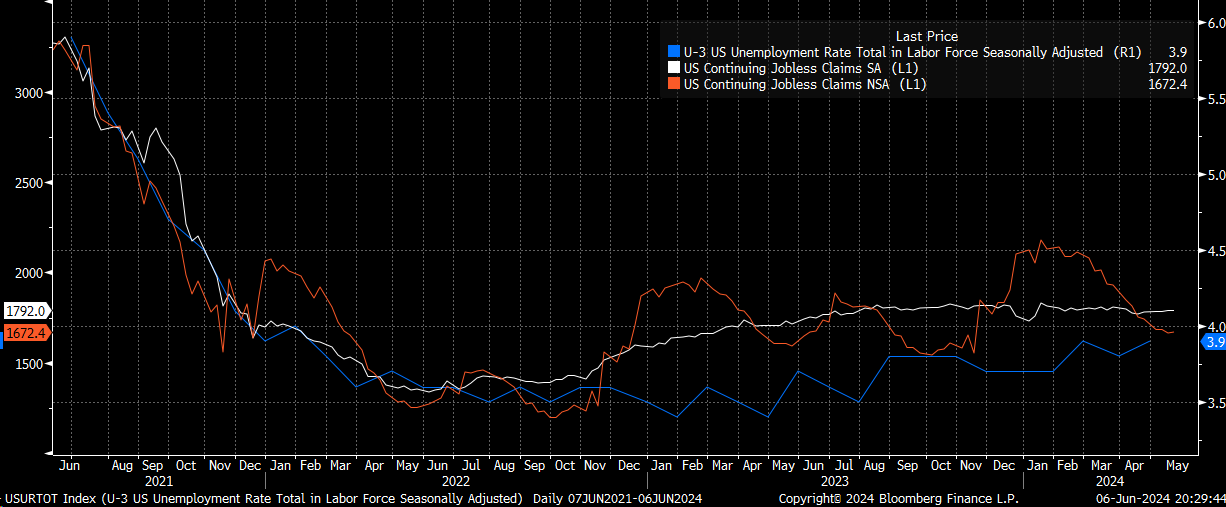
Anyway, sarcasm aside, there is not much evidence to suggest that the unemployment rate is due for a sudden rise; we aren’t even seeing unemployment claims or continuing claims rising. Even considering the non-seasonal adjusted basis, they have been coming down lately.
Estimates are for 3.9%, which would align with last month. Could we tick to 4.0%? I guess, all that would take is probably a few hundred thousand people entering the labor force that had been idle. The surveys have shown some reduced hiring but have talked about wage pressures pushing up input costs.
Meanwhile, the nonfarm payroll is expected to rise by 180,000, and the Bloomberg whisper number is 165,000. So, expectations for today seem pretty low. The low expectations could be why we didn’t see the VIX 1-day rise much yesterday and only got to 13.3. On April 4 and May 2, the day before the report, the VIX 1-day closed at 21.4 and 18.33, respectively, so the close of 13.3 is low, and if there is an IV crush, it will probably be small and short-lived.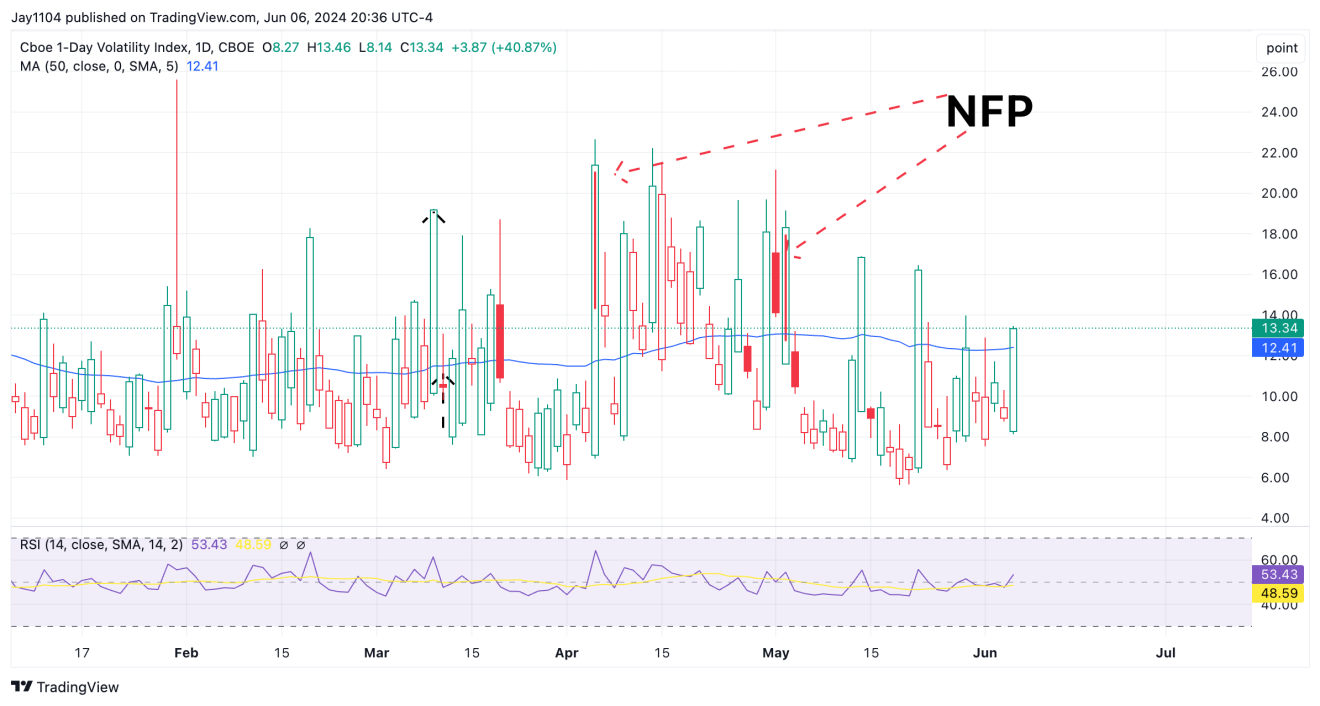
We have seen the USD/MXN surge in the last few days, and to this point, the risk gauge has NOT translated to changes in the equity market. This is frustrating in many ways because it has worked well for some time, and now that there is volatility in it, it is not working. But like anything, it can work with lags, and nothing works all the time, but it has been reliable in the past for a long time, and so now is the one time you would like for it to do its job and of course, so far it hasn’t worked.

We could certainly see a market drop coming. There appears to be a bear flag in the Nvidia (NASDAQ:NVDA)-less Dow.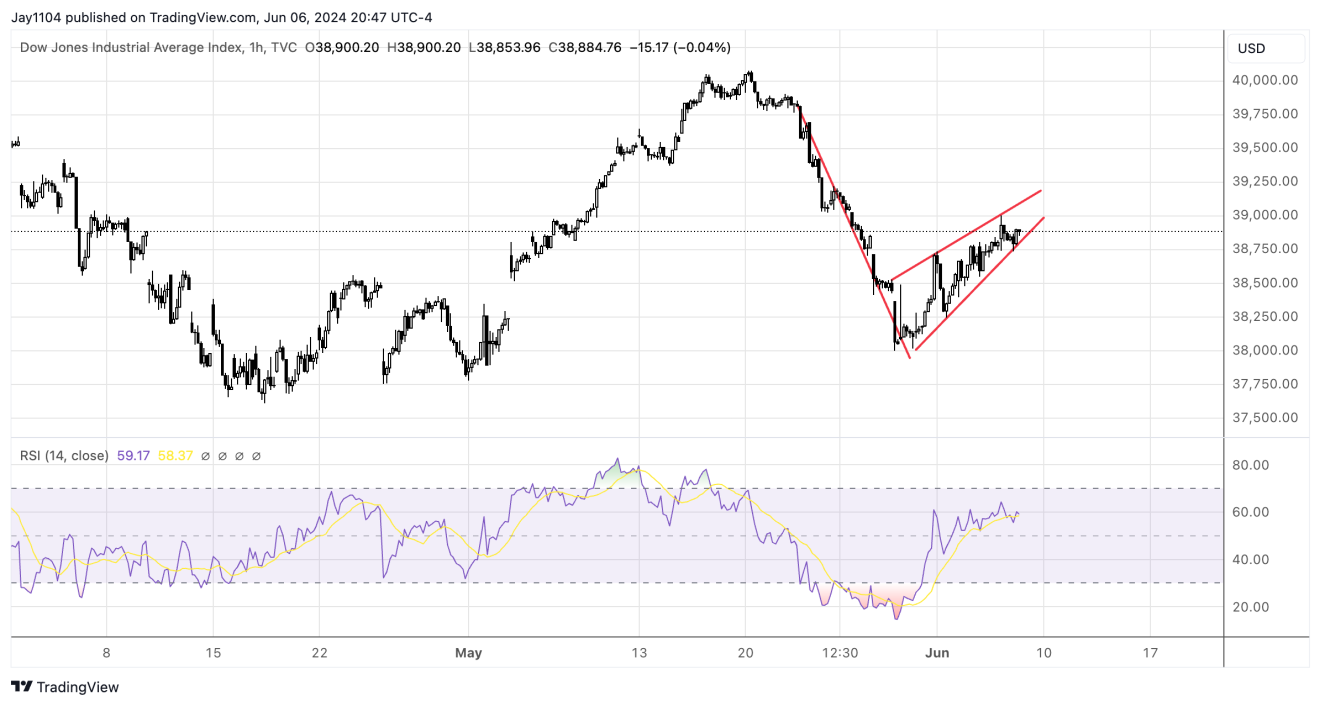
Interestingly, the HGX index has been weak recently despite falling interest rates. It is not what I would expect to see. Still, it either means that rates are heading higher or something else is going on because, typically, rates and HGX only go lower together when the economy is slowing.
The S&P 500 also appears to have formed a rising wedge, approaching the point that one would expect it to break to the downside, as most rising wedges do. This is also the 1.618 extension of the initial rally from the March 2023 low to the July 2023 high to the October 2023 low. So, this would make a nice spot of an ending diagonal triangle.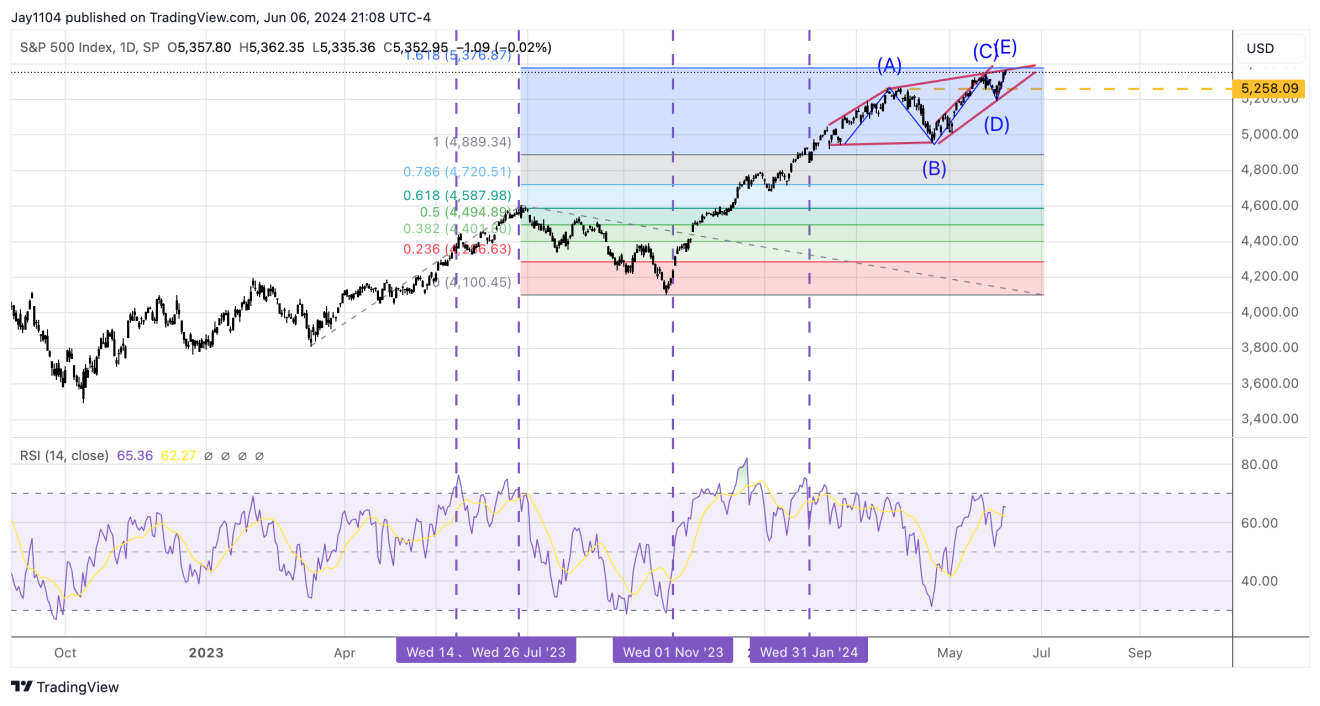
The NASDAQ 100 is also closing in on its 100% extension of the same time frame. It also has that rising wedge pattern in place.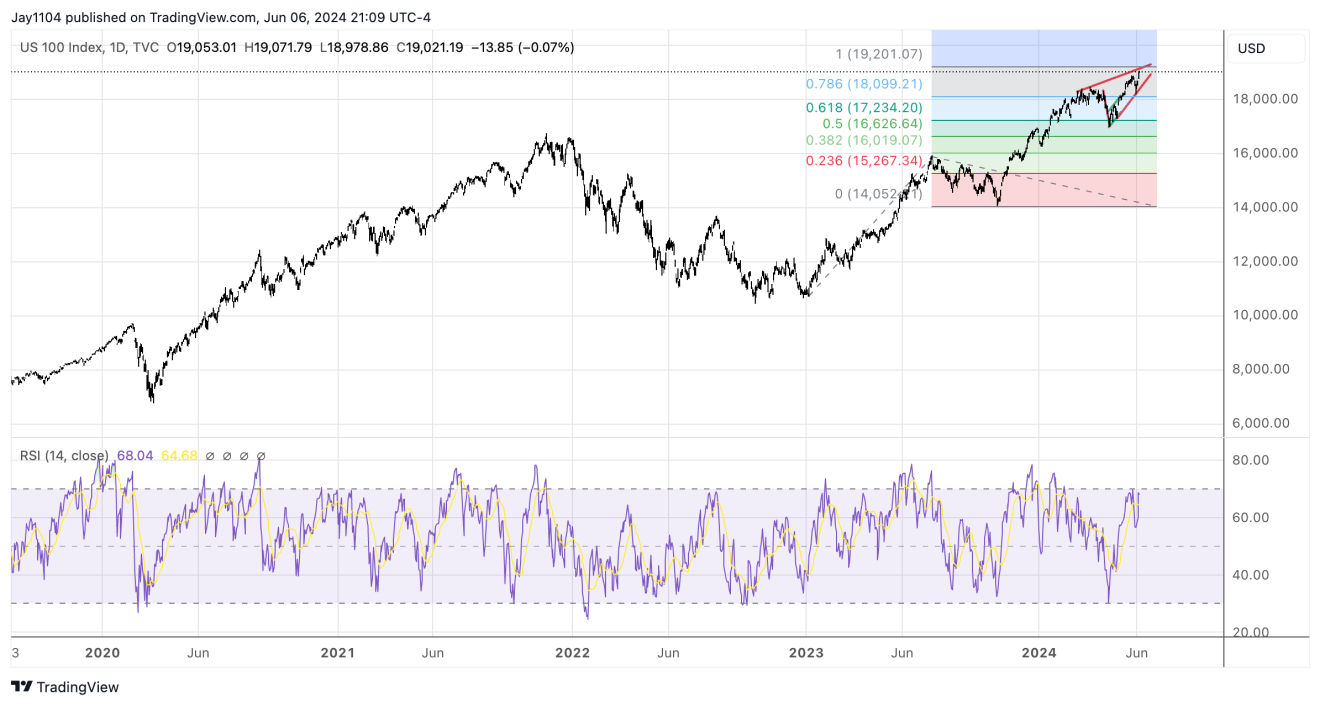
It also marks a 100% extension of the Nvidia rally from the January 2024 breakout to the March high to the April low.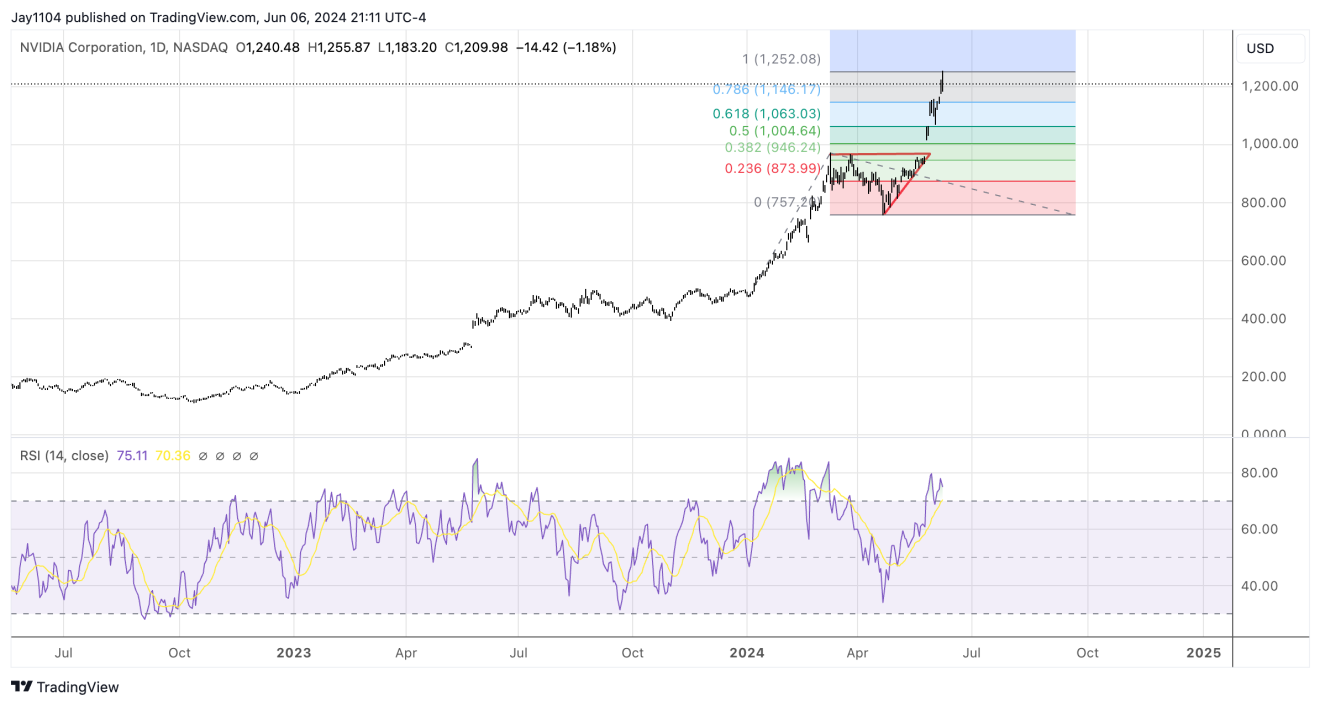
Meanwhile, Nvidia is trading outside its upper Bollinger band on a monthly chart and has an RSI of 87. I can’t say that I remember the last time I saw something I overbought on a monthly chart. It certainly wouldn’t be surprising to see it come back down within that upper Bollinger band before the end of the month, but for that to happen, the stock only needs to trade below 1,114. That’s not all that much, considering how big the moves have been in recent weeks.
Original Post